Showing posts with label Commodities. Show all posts

Wednesday, February 21, 2024

Bought Malaysia Smelting Corporation

Update on this company - it hasn't changed after my initial post more than a year ago.

Start with the tin price - it was stable in 2023: lower than 1H 2022, higher than 2H 2022:

The company has 2 segments, Tin Mining and Tin Smelting:

Smelting profits should be more stable, but were impacted by Covid in 2022 and the closing of an old smelting facility in 2023.  Its hard to tell which of the 4Q23 costs are one-offs or which are normal operating costs (either recurring or randomly occurring ones).  They have moved to a new smelter in P. Indah, which started operating in 2021.  They will start dismantling the old Butterworth smelter in 2024. 

The biggest risk seems to be that smelting profits/losses are inconsistent (especially Q423's loss), and we don't know how long this will continue.

Mining profits tend to follow the tin price, with variable revenue and fixed costs:

Don't overthink it.  Its a company that primarily makes money from Tin Mining - the profits and share price follow the tin price.

The company has adopted a dividend policy paying out at least 30% profits.  The 7 sen dividend is 34% of 2022 profits.  2023 earnings look "normal" - not too peak-ish.  At RM 2.10, it would be trading at 10 times 2023 earnings.


I bought MSC this week on the KLSE, making up 5% of my portfolio.

Saturday, February 17, 2024

Bought Oil, Sold Gold

A few hours after my previous post, Hedgeye's trading signal on oil changed to bullish trend. I've been waiting for months for this, so I bought a whole lot of oil stocks.  From 5% to 15%.  Risky, because its overbought and the signal can always flip back, but now is as good a time as any.

I still think we are in a decade of inflation.  I expect oil to maintain its price for one or two years, then explode in 2025 or 2026.  Like Uranium now.  Meanwhile, I'm paid to wait as oil companies gush cash (at 2023 oil prices) with generous dividends or buybacks.  For context, after peaking in 2022, the oil price hovered between $70-90 last year:

CNQ is a Canadian oil sands producer with long-life reserves, profitable, with generous dividends and share buybacks:

In 1Q24 they target to reduce net debt to 10 billion, after which they'll return 100% of free cashflow to shareholders.  I estimate either doubling dividends, or more than doubling share-buybacks.  Annualising their 9M23 profits, they are trading at a PE of 13.

Acker BP is a Norwegian O&G producer, that is still paying down debt but still also pays dividends:

Its trading at 12X 2023 earnings.

Var Energy is a smaller Norwegian producer, from Modern Investing Substack.  Although they pay dividends, they are a growth story, aiming to increase production by 50% by 2025.  Its trading 8 times 2023 earnings.  This company has more operational risk. 

The risks are politics and ESG.  Norway's district court overturned approval for several oil projects. While Canada will introduce a carbon tax.

Also sold my gold I'm as no longer expecting a recession.  And I need cash to buy stocks.

Saturday, July 29, 2023

Bought Vermillion Energy (VET)

Hedgeye's oil price Risk Range went to bullish trend on the 17th July after being bearish for a year.

Looking for something to trade, I came across Vermillion Energy:

  • Half its 1Q22 revenue is from oil (2/3rds of that from Canada, 1/3rd from Europe), and half from gas (70% of this half is priced in AECO (Canada), 30% from Europe.  in Q2, we expect 40% from Europe).
  • Leverage on the high side, they are concentrating on reducing it.  Mostly fixed rate.  Negligible dividend.  Some buybacks.
  • 2P reserves of 14 years, not great.  Read somewhere there are some questions about how they depreciate their reserves.  No breakdown by oil and gas.
  • Its a high beta stock: it dropped 60% from the peak last July's peak to the trough.  Could be due to Canada's oil and gas pricing varying more than WTI (due to lack of transportation from Canada) and the wild variations in European gas pricing.
  • 1Q22 Annualised EPS is $8, trading at CAD 18, thats less than 3X a year's earnings.  Not a lot has to go right.
  • European Windfall taxes end in Dec 2023....if they are not renewed.  Pro forma, removal of the windfall tax would have added another 5% to their 1Q22 earnings.
Its a trade - not a Buffet-like stock to pass to your grandkids.  Hopefully the trend lasts a few months or quarters.  I'll sell it when Hedgeye's oil trend changes.  Would not hold a stock this volatile thru a downturn.

Bought a 1% position last night @ USD 13.25, after the stock dipped for 4 days.  I would go up to 3%.  The problem is it rarely dips enough to take a big position.


My positions haven't changed much:
  • The portfolio is quite oily, and has started to go up with oil.
  • Removed some shorts that changed to bullish trend.
  • Added some long term index puts.
  • Have VET and Silver in an "Inflation Trades" basket.  2% total.


Update 6th Aug 2023:
  • Increased VET position to 2.5%.  It wont go down enough to buy a big position.
  • Silver position increased to 1.5%.
  • SPX looking bearish, may buy more puts (June 24) if we get a bounce next week.  If things work out this could be my last chance to buy.

Update: 8th Aug 2023 morning: Increased VET to 3% last night.  Last night's rebound was weak.  SPX is no longer oversold, AAPL has broken down and VIX has broken out.  Look to press shorts, probably tonight.

Saturday, June 10, 2023

Rare Earths: An Introduction

(Updated: 29th June 2023)

Quick notes on Rare Earth Elements (REEs) which are are used to make magnets used in hybrids, EVs and windmills.

It takes years to enter the rare earths business, because:

  • As you're extracting 7 or 8 elements, processing is far more technical and complex, than an iron ore or copper mine for example.
  • There's no benchmark pricing, so its hard to new entrants to get long term contracts needed for financing.
  • Production involves several steps.  And for each step, the product has to go through a rigid qualification process.  So you usually complete one step at a time, each of which takes one or two years.

Processing Stages

The steps involves are:
  • Mine the ores (which have < 10% concentration of Total Rare Earth Oxides (TREO)) and upgrade it to concentrates of at least 60% TREO for further processing.  Starts with a mechanical process, followed by a chemical process.

The rare earths we want for magnets are Nd, Pr, Tb and Dy.  The elements on the left are low priced money losers, and the heavier ones on the right are precious.  So the concentrations of different light and heavy elements matter.  For example, typically you may have 25% La, 25% Ce and 1% Dy.  Current prices (USD/kg, early June 2023) are in pink - see the wide variation.

Scandium (Sc) is not really an REE (its like aluminium), so is not subject to the above extraction order.  Its grouped with REEs because its often found with them.

This is the hardest stage of production.  It is challenging for a newcomer to prove they can produce the correct amounts of oxides consistently.

  • Produce Alloys from the oxides.  Low margin business which requires strong environmental safeguards.
  • Produce Magnets.  Needs to be produced under license, using patents for one of 2 processes.  Both processes were developed in the 80's: one by GM is now held by a Chinese company, and  another by Sumitomo which is now held by Hitachi. So you need to license from Hitachi.

Industry Structure

There are 5-10 producers within China, and 2 outside it (Lynas and MP):

Other Chinese companies (not shown above) are China Rare Earth Group (a merger of 6 SOEs), Shenghe Resources (who buys from MP above), GuangSheng Nonferrous, Yuijing & Huicheng Environmental Protection.  A lot of China's rare earth production is a side-product (eg: from iron ore), so it does not have to be economical.

China dominates rare earths metals at every stage.  Its been hard for other junior producers to start up, as they have to build a mine and separation facilities (around $25-50m), while arranging off-take agreements to get financing, under the shadow of China holding prices below production cost.  This prevented new players emerging, at least till the 2021 bull market.  It takes around 3-5 years to get mining and separation facilities up and running. 

Prices

I haven't been able to find free long term charts of all the rare earth elements.  But they seem to follow each other:

La, Cr, Nd and Pr: 2003 to 2015:

Source: Resaerchgate

La, Nd and Pr: 2008 to 2018:

The only recent chart:

Source: tradingeconomics 

Prices peaked in 2011 after China blocked exports to Japan in 2010, for a week.  They peaked again in the "everything bubble" of 2021/22, before falling 55%.  A bet on REEs now is a bet that increasing EV penetration and "green energy" drives demand up, while supply takes time to come online (takes years to start up mines and separation facilities) despite US government subsidies.

Monday, October 17, 2022

MetalsX (ASX)

My last piece on Tin.  There's 3 listed tin producers.  The third one produces in the DRC which is un-investible.  This one is in Australia, which is safer.

Business

A 50% JV in the Renison Tin mine, a hundred year old mine in Tasmania which is still producing.  Mine life is projected until 2030, with scope for further extension.

They also own 50% of Rentails: tailings dams from historical mining operations containing around 100,000 tonnes of tin.  Significant capex is required to bring this into production.  A new DFS should be completed this year to make a decision in 2023.

They used to own copper and nickel interests but these lost lots of money.  They sold them off and are now purely focused on tin.

Balance Sheet

All numbers are from their June 2022 Annual Report.

They has a windfall from FY2022's high tin prices.  They used it to pay down their debt, and now have 110m in net cash.   Held  as AUD.

Quick side note: They have 28m of convertible notes receivables.  After selling their Copper/Nickel operations, they lent money to develop them, and should be paid back in (MetalX's choice of) cash or shares in March 2025.  New mining operations are dodgy, especially in a recession, so let's wait to see if they get paid back.

Despite the 2022 windfall, they have not paid dividends.  I think they need the money for capex.

Capex

Sustaining capex is 8-10m per year (p10).

In addition, to continue production at Renison until 2030 (Area 5), they need 50-55m capex (p5).

Both the above can be covered by their 2022 windfall.

In 2023 they should make a decision on rentails.  An old 2017 estimate is 205m (or around half of this for MLX's share - p14).  Lets say 100m in 2017 dollars, which might be 150-200m today.  Can be funded from their cashflows if we get another tin spike in the coming years, but don't expect MetalsX to pay dividends anytime soon.

Earning, Cashflows and Breakeven

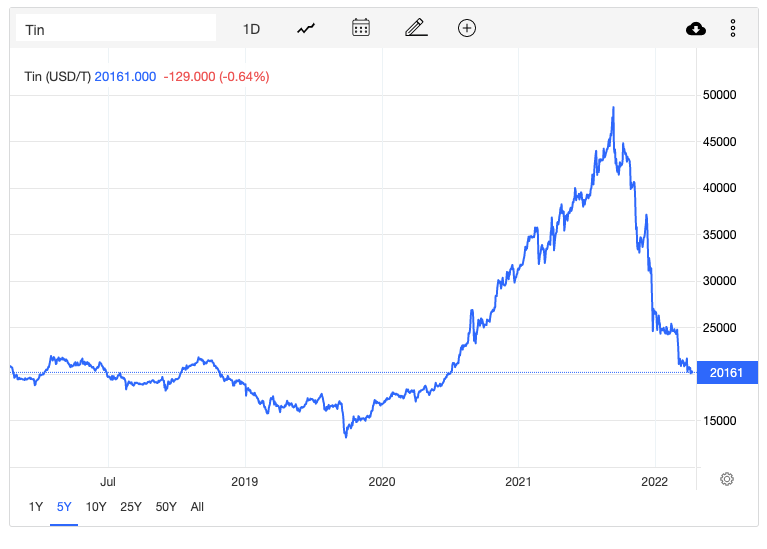
Our starting point is always the tin price:

Its hard to look at their long term profitability because past tin results are overshadowed by their money losing copper/nickel operations.  Their 2021 AR was the first time they stripped these out. My breakdown of their profits from 2020 onwards, important lines in blue:

As expected, the biggest factor affecting profits is revenue (ASP).  This company is highly cyclical.

I estimate their cash breakeven tin price at around AUD 17-22k/ton.  At that price their Cashflows from Ops would be zero.  If we also cover sustaining capex of 10m per year, we get a required tin price of AUD 19-25K (or 11.8 to 15.5K USD today).   The company estimated their AISC at AUD 17K/ton (p3), which I guess is too low.  Estimates in AUD are tricky because the AUD is so volatile.

Don't think they've been hedging the tin price, there was no mention of commodities derivatives.

Reserves

Excluding Rentails:

Misc

Information is quite skimpy.  I could not find any quarterly results on their website or ASX.  Nor any transcripts of shareholder meetings.

Yunnan Tin is the logical acquirer of this company (their 50% partner in the JV).  Unlikely to happen now since everyone hates the CCP.

Don't buy right now:

Saturday, October 8, 2022

Malaysian Smelting Corporation (KLSE)

MSC is a Malaysian tin miner and smelter.  Most profits are from mining and are highly cyclical.  It will benefit from any future tin bubble

Its listed on the KLSE (not accessible from Interactive Brokers).  Illiquid enough that only retail players can buy it.  A secondary listing on SGX (accessible from IB) is too illiquid even for retail - some days only a few thousand shares trade.

Business

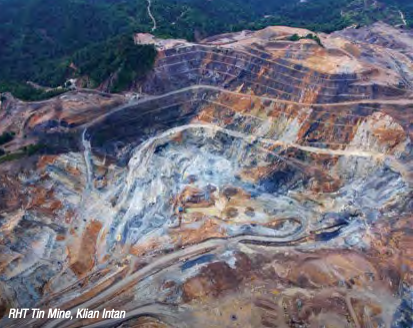
Most of their mining is from their RHT mine in Perak, the largest hard-rock open-pit tin mine in the country, operating for over 100 years.  Their lease expires in 2034.  They also have some mining at their 80%-owned subsidiary SL Tin in Pahang (Sungei Lembing), currently producing ~1% of their production, it may ramp up to 40+% in the next few years.

For smelting, they are the world's third largest refined tin producer.  "Over 10% of MSC’s smelting input is supplied by RHT, while the remaining intake comes from local artisanal tin miners and third-party tin mines outside of Malaysia, such as Australia and Africa."

I'm concentrating on mining, as its the most profitable segment and where I expect the next bubble.  Tin smelting is easy - its been done for thousands of years and you can do it in your back yard.

Resources

MSC gives "Resources", not "Reserves".  Resources infer how much of the resource exists in the ground, while "Reserves" are those "Resources" that can be economically extracted.  This is the first commodity company I came across that does not give "Reserves".   I've heard that for tin, the volume and grade of ore inside the ground is unimportant, what matters is the ore type and grain size (paid link).

Most of their exploration is around their existing mine, which is the best place to look for new tin.  It still took years of drilling and false starts to find a new ore body:

2021 tin production was 2408 tonnes, so they have 10 years of extraction remaining (assuming half of the resources can be economically extracted).

Balance Sheet

Quite clean.  As of June 22, borrowings and lease liabilities were under RM 500m, cash was RM 185m, while 6 month profit-before-tax was ~ RM100m (albeit in a boom period).  So they could pay off their debt in a couple of years in a boom.

No new shares have been issued since at least 2012.  A stock-split and bonus issue quadrupled the number of shares in 2018 (without issuing new equity).

Profitability

Profitability follows the tin price:


And the stock price has also followed the tin price:


Since 2021 was an outstanding year, they paid out 25% of 2021's net profit.  I found no dividend policy.  The shares are too illiquid for buybacks.  I like that they paid some profit as dividends to reward shareholders - too many tightly controlled Asian companies become value traps.

MSC is 52% Owned by Singapore company Straits Trading.  Might be good, as it prevents any hostile takeover (....except by Straits Trading).  I want the shares to stay listed to participate in the bubble.

Conclusion

Safe business, with highly cyclical profits, operationally levered to tin prices.  Could be a great tin play in the next bull market.  As a micro cap, it may not move till late in the cycle.

Don't buy now as we're still in a bear market heading into a recession.

Saturday, August 20, 2022

Tin

Tin is a tiny market, not covered by any analysts.  Needed for electronics and renewable energy.  It can fly in the next bull market.

May 2022 Tin Panel with Adrian Godas and Piet VanRusselt.  The presentation is disjointed and slides blurry, so I try to provide a summary here.  Timestamps in (brackets).

(1:30) Demand

History of Tin:

  • Tin can be bent but doesn't break
  • 3300 to 1000 BC, bronze (Cu + tin)
  • Cornwall: was producing from 2000BC to 1989, they may be restarting now.
Past price cycles:
  • 1960 : 5K/ton.  1956: first tin council, tried to control the market, export quota.  Up to 20K in 1980.  Producers (outside the council grew from 10% to 30%).
  • 1980: M'sia tried to corner the market with Marc Rich (of Glencore), they lowered exports.    The tin council saw it happening, they limited backwardation, the price dripped in 1 year back to 15K.  In 1985, tin council went bankrupt, buying buffer stock (120K tones, when the market was 200K tons per year).  Market went back to 5K.   
  • (6:25)  1990s: Start of computers.  Big ramp up in price.
  • 2008 price back to 5K in a few months.  Few years later back to 33K.
  • Last month (April 2022) from $50K to $35K in a month, common in such a small market. Market size is 350-380kt per year, so a small 10-20kt change makes a big difference.
  • (7:20) Conflict free tin (in 2010), sourcing of big suppliers agreed to responsible tin sourcing.  Alphamin.  Artisanal mine: taken over by them to make it an official (conflict free) mine.
Lead free tin:
  • (13:53) Previously used 60:40 tin:lead mix in EU, but banned in 2006
  • (8:15) Lead free tin.  Lead used to be a big part of solder.  Now in solder: 89% tin, 3-8% silver.  A small amount of lead: 0.1%.
Tin Market Size:
  • (9:10) Tin is a niche market: 10-15bn dollars a year.  1/10th of the copper market, 1/20th of the gold market.   No analysts following it.
  • Market size is 350-380kt per year
Market Demand and Catalysts:
  • (10:00) Demand catalysts:  50% solder, driven by renewable energy. Solar power in 2015 used 5kt, today its using 18-20kt, expect in 5 years will be 30kt.    
  • (10:45) 5G: we have 30-40% more chips in phone.
  • (11:15) EV content is 800g to 1.5kg, ICE vehicle is 400g.
  • A challenge for tin demand: miniaturisation of chips: need less chips so less solder.
  • The slide flashed at (13:54) shows tin demand for renewable energy:
  • (14:00) Only 1g of tin in a smartphone.  Tin price can rise 10X without affecting the smartphone.


(13:43) Supply.  The demand story is great, the supply story is better.

This presentation is for tin concentrate.  It does not cover smeltering and refining into final tin product.  

(15:18) Breakdown by countries.  Slide blurry.  The numbers on the bottom right are probably from here:

One third production in China.  A quarter from Indonesia.  10% from Peru, and another 10% from Burma (which may as well be China).

(15:41) @Respulator 's numbers:


(16:08) China.  Flat supply for 20 years.  Mostly from mature mines in Yunan.  A few new ones in Inner Mongolia.  

  • Example: Geiju: big mine, world class asset.  They say they cant increase production.  This article provides some color on Geiju's demise: it looks like a dying cowboy town.

(17:14) Indonesia.  PT Timah controls all smelting, majority of production is from sea ("artisanal mining") which fucks the environment.

  • Supply varies, depends on Monsoons.
  • Thinks that rising costs create a new tin price floor at $30K
(18:46) Burma.  
  • Only started producing in 2011.
  • A wildcard.  Maybe hard to produce as mines need to produce underground, in war zones in the middle of the jungle in the country's interior.  But they may keep finding new resources.

(20:01) Africa.  5 mines listed.

(21:20) South America: All from Boliva, Brazil and Peru.


(22:12) Australia.  Had a lot of past production, but only one producing mine (MetalsX - 8K per year).  A lot of potential mines (Ardlethan, Cleveland, Granville, Heemskirk) - but he thinks they have bad metallurgy, with too much sulfites.  Maybe Toronga can come online in future,

(23:08) Europe.  Hopeful that South Crofty (Cornwall - 3K) and Tellehauser (Germany - 3K) can come on line in a few years.

(24:19) Other:

  • Syrymbet: Potential 6.5K in Kazakstan.  Complex metalurgy/ore, many by-products.  Has had a decade of feasibility studies with nothing built.  
  • Russia: Silligdar: want to expand 2K.

(25:18) Supply conclusion:

  • Production to fall to 250K by 2030
  • Only 2 new projects.  B2 tailings in Preu, Mpana in Congo
  • Big mining companies cannot invest, its too small.  They could buy the whole sector many times over.
(26:05) Evaluation of new projects:


He things real supply growth in 5 years is 34kt per year.  Will not fufill new demand.

(28:35) Estimated final balance:


Got a feeling this will be important later:


(30:20) Questions

(30:31) Recycling?  He can't find any info.  Tin market too small.

  • Because its always used in small quantities (iPhone is 5 or 6c, and they can recover only half of it).
  • Electronics is easier.  
  • Chemicals is impossible.  10X more costly that new tin.
  • (32:23) Some efforts to substitute tin in solar.  Probably go back to lead.  They have tried to use resins, but not conductive enough, adds complexity to assembly process.
  • Substitute (in PVC?), use thin (calcium?), but worse performance.
  • Silver is too sensitive to heat to use as solder.
  • Third recycling source is tinplate is now 10-12% demand, going down 1% every year.

(37:00) Can big miners return?  He thinks its too small.  Alphamin is only worth 1bn, don't even bother with due diligence.  The selling point for Alphamin is supply security, not profits.

(40:42) How would you play the expected increase in tin price.  Alphamin will probably be taken over, MetalsX is the only remaining producer.  They do not bother with explorers.

41:81: Not looking at explorers, the producers are cheap enough.

41:50: Scale of PT Timah and their ability to scale.  Trying to predict artisanal miners output is impossible.  Other sectors (fishing, tourism) are complaining because the tine miners are destroying environment.  Vietnam, SEA or African artisanal miners may be able to increase production.  This is a risk to the bull thesis because a small increase of even 10kt may change the market.  

Monday, August 8, 2022

Norsk Hydro

Norsk Hydro is an integrated, low-cost Norwegian Aluminium producer, one of the few outside China.

The Aluminium Production Process

Aluminium is produced in several steps:

  • Bauxite (Aluminium Ore) is mined.  There is no shortage of bauxite in the world.
  • Alumina (Aluminium Oxide) is refined from bauxite by a chemical process.
  • Aluminium is extracted from alumina, using electrolysis to break up the aluminium/oxygen bonds.  This is energy intensive.  30% of the aluminium price is accounted for by electricity.
  • Extrusions.  Aluminium shaped into bars for industrial use:

The Aluminium Market

China produces 40-60% of the worlds aluminium:

Source: international-aluminium.org (Interactive chart) 

This is powered by cheap coal.  Due to power shortages, China became a net importer in 2021.  Now Europe has energy shortages and China's coal-based production is ramping up again.

So aluminium is one of the few commodities that may go *up* if China collapses or invades Taiwan.

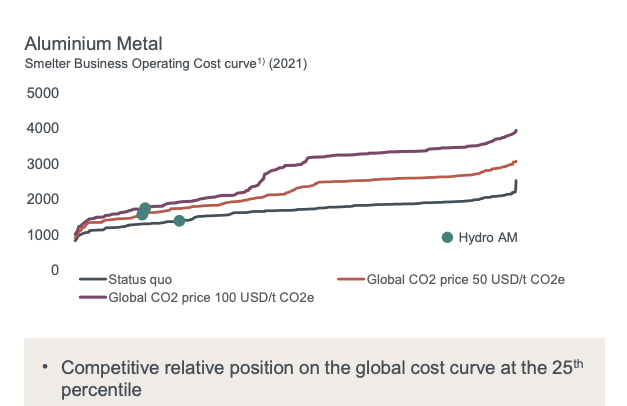
Norsk Hydro puts themselves just in the 1st quartile of the cost curve.  Lower, if CO2 emissions are taken to have a cost:

Source: Company Presentation March 2022 (slide 11)

Norsk Hydro Businesses

Main Segments Segments

In 2021, about half of revenue and 80% of EBIT are from bauxite, alumina, energy and aluminium combined.  I count these segments together since the outputs of one segment are the inputs to another.  The main cost drivers are energy, labour and carbon.  The main profit driver is the LME aluminium price.

The mining and processing of bauxite into alumina takes place mostly in Brazil.  Most of the alumina is shipped to Norway, where they produce Aluminium using electricity from hydro power (their "Energy" segment).

Half of revenue and 20% of EBIT is from extrusions (aluminium metal shaped into long pieces, like steel rebar).  Its a margin (cost plus) business, unaffected by raw material prices.

Upcoming Business Segments

They have a number of upcoming businesses:

  • Recycling: A small business, where they source, sort, recycle and produce products (slide 21).  Some capex is required for sorting and recycling plants.  Recycling is a margin business, and less capital intensive than aluminium production, and with a high IRR.  2021 EBIDTA was 160m (~ 0.5% EBIDTA), aim for 700-1.1bn NOK in 2025 (at 1:06).
  • HydroRein: Using wind and solar to decarbonize aluminium production.  Building greenfield wind and solar parks is capital intensive and usually done in partnership with Norsk taking a minority stake.  Possible IPO (slide 9).
  • Batteries: Hydro is also investing in battery production for EVs (slide 10).  2.5-3b capex per year till 2025 (p12).
  • Havrand: Using electricity to generate green hydrogen to eventually replace their own natural gas usage.  Short on details: seems to be at the R&D stage.
  • HalZero: New R&D project which successfully converts Alumina to Aluminium without releasing carbon dioxide.
I have some concerns with these.  HydroRein will need a lot of capital: a 2021 presentation (slide 8) says an equity raise is being considered.  A lot of battery capacity will be needed to convert intermittent wind/solar to baseload power - I''m not sure if lithium-ion batteries are suitable.  And producing these types of batteries for EVs seems a distraction.  I have not heard of hydrogen being stored/piped on an industrial scale: the closest I've come across is Air Products' hydrogen pipe network.  Hydrogen is hard to transport/store as the gas molecules are too small.  Hydrogen pipes have to be sealed a lot tighter than for natural gas, and hydrogen liquifies at higher pressure and lower temperatures than LNG.  Hydrogen embrittlement affects steel tanks//pipes.

In short, I'm worried they may end up spending too much on unproven technologies just to appear green.  I'll come back to the capex numbers later.

The Numbers

All numbers are in NOK.

Balance Sheet

Very strong.  After an exceptional 1H22, net debt is 5b, less than an average year's free cashflow.

Cashflows

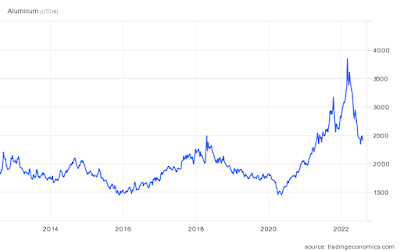
Since the aluminium price is the biggest factor affecting profits, start with it:
\

Norsk Hydro's operating cashflows:

Movements in working capital are quite large, so I remove them - they should cancel out over time anyway.  After that, the orange bar follows the aluminium price, as expected.  1H22 cashflows are massive.

Average CFO over the past 10n years was 9.7b (excluding 1H22's spike) and 11.6b (including it).

Now lets add Cashflow from Investments:

After subtracting CFI, cashflows are usually positive (yellow line).  The average yellow bar over the past 10 years is 7.1b (excluding 1H22's massive spike) and 9b (including it).  

Is 1H12022 an aberration?  The very top of the cycle?  Or is it the new normal after Aluminium prices have been artificially depressed for a decade by subsidised production (in China), cheap energy and globalisation?

Capex

Total capex in 2021 was NOK 6.9b. Most of this seems to be maintainehnce capex, they did not break it down (p31).

Capex is expected to be 9-11b per year (147:25) between 2022 and 2025.  Of that, sustaining capex is 6 to 6.5b:

Source: Capital markets Day 2021 (slide 67)

REIN and Havrand are *not* included in the above capex guidance, and are mostly separate from the parent company.  "The external equity injections based on capital raises in their respective companies allocated to the specific project's SPV will impact Hydro's consolidated capex, but not their cashflow.  Non-recourse project financing at SPV level, which will cover the majority of investments in REIN and Havrand is target to not impact Hydra's balance sheet" (1:46:56).

So basically, plans now are for ~10b per year of capex in the next 4 years.

The above capex is part of the plans to reduce CO2 emissions by 30% by 2030. This looks reasonable (eg: switching to natty from oil for Brazil's Alumina production).  But thery have further plans to become a "Net Zero" company after 2030:

Source: 2Q22 Investor presentation

That part looks pretty vague.  Again, I am worried about the technology not being feasible.  Chemical & industrial processes don't scale.  You can't just run them on AWS.

Capital Structure and Dividends

The target dividend payout ratio now 50% (of profits) over the cycle, with a floor NOK 1.25 per share (NOK 2.5b in total).

2021's dividend is 6.5 NOK per share (or a total of NOK 14b).  Plus a 2b share buyback, so 16b.  This is way over a 100% payout ratio, so not sustainable. 1H22's results were spectacular, with almost 15b CFO, but we have several years of 10b capex in front of us and commodity prices are always uncertain.  I would be a bit more comfortable if they paid for that first, before dividends.  Norway's government has a 1/3rd stake in this company, and I wonder if they pushed for higher dividends.

Their net debt is 5bn, and they target 25b debt over the cycle (slide 11).

As of 2Q22, they have hedged some production going forward at prices slightly above today's price (slide 24):

Valuation

Against a market cap of 131bn (@ today's share price of NOK 64.2):

  • Based on the last 10 years free cashflows (yellow bar), its 18.5 times FCF (if we exclude 1H22 earnings), or 14.5 times if we don't.
  • Or 11 times 2021 (peakish?) earnings.

Commodity stocks can't be valued, since you are just predicting the commodity price. 

Conclusion

I'd like to buy, but its too expensive now based on pre-2021 results.

We are in a bear market now, and I think the price of Aluminium (and Hydro shares) drop for a while.  May be worthwhile later, when the cycle turns, inflation comes back and energy supplies get squeezed again.  Bonus as a possible hedge against China.

After 2020, this stock will probably never be "dirt cheap", the best we can hope is to buy it at a fair value and ride the next commodity price wave.

Misc

The company suffered a ransomware attack in 2019.  They did not pay, and rebuilt their operations. 


Friday, April 29, 2022

Atalaya Copper

Atalaya is a small, copper miner, producing from a single mature mine in Spain.  Its listed on AIM/TSE.  Mkt cap is around 700m Euros.  I was attracted by the dividends.

Operations

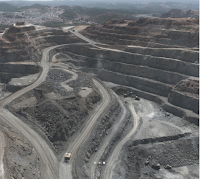
They have been producing from their Cerro Colorado pit in the RioTinto mine near Seville (south Spain) since 2016.  From their 2022 production guidance (15.5Mt/year) and Proven Reserves on their website (128Mt @ 0.41% cutoff), the mine has 8 years life remaining.  Their June 2021 reserve estimate gives proven reserves of 139Mt @ 0.38% Cu, estimating a 12 year lifespan (ie: 11 years from now).  So this mine's lifespan is somewhere between 8 and 11 years.

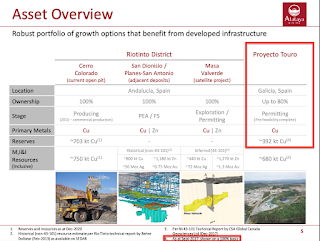
They have new mine (Touro) in the north of Spain undergoing permitting. This has half the reserves and roughly half the potential production of Cerro Colorado:

And like any mining company, they have a number exploration projects ongoing.  Most are surrounding RioTinto:

Finances

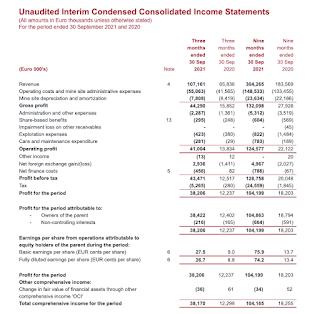
The finances look simple and clean.  Normal looking income statement: 


They were profitable in 2020.

Low debt, net cash position.

They declared their first dividend late last year, and plan to payout 30-50% of free cashflows this year onwards.  The (annualised) yield based on that is 8.6% (at a share price of 4.50 GBP).  And that was 45% of earnings.  Can't extrapolate that into the future since it all depends on the copper price.

Risks

They are producing from a single mine.  Anything that goes wrong there affects their entire production.

Cerro Colorado only has an 8-11 year lifespan.  Production should start soon at Touro, but this is only half the size.  They need more projects to work out, just to replace Cerro Colorado.

Not much Geopolitical risk.  I like to own copper production away from Chile and Argentina, who are raising resource taxes.

I think Spain's gonna have a currency crisis and leave the EU, but that doesn't affect mining.  And I think Spain is not as safe a jurisdiction as Canada or Australia, but its better than Latin America or Indonesia.  With mining you can't be choosy.

Misc

Spain has a 19% withholding tax.  Should be 5% for Singapore residents (p7), but I'll need to see what Interactive Brokers charges.

I got this idea from an 2021 interview (paid link) on CruxInvestor.  He starts talking about Atalaya's projects at 22:00.  Dividends and acquisitions/mergers at 27:00.  Expansion at 39:40.

Conclusion

Production is from a single mature, low grade mine.  Sustainable for 8-11 years.  They are profitable by running it efficiently.

Their long term future depends on bringing on production from the areas surrounding Cerro Colorado.  This ends up being a binary event - either one of them works or it doesn't.  There is a lot of luck in mining.  The most likely place to find new reserves is next to an existing mine.

Saturday, February 12, 2022

Lithium

I think we get a market correction this year followed by a wild boom into 2023/24.  Beyond my boring dividend stocks, I'm looking for speculative risk-on assets to hold in the coming melt-up.  Stuff that can make me rich.

Lithium might be one. 


Its a way of playing the EV boom without having to pick winners among car or battery manufacturers.  For a commodity, a rising tide lifts all boats.

Lithium Demand and Supply

The textbook way to estimate a commodity's price is to model future demand against supply and see how they balance out.  With lithium its pointless.  Typical estimates have EV sales and lithium supply doubling from 2022 to 2025, then doubling again by 2030.  Both the supply and demand charts look exponential.  With such high growth rates, small change makes a big difference.  Any numbers you toss around are a wild guess.

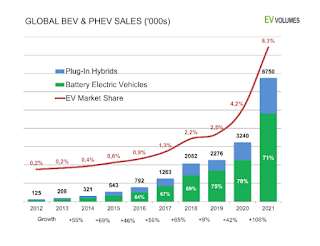
On the demand side: I think electric vehicles are becoming mainstream in developed countries.  Ford's F150 lightning selling out, for example.  I think they become something that normal people want to drive.  EV's had an 8.3% market share in 2021, they have plenty of way to go:

Exponential chart.  Source: EV-volumes.com

For supply: while you can find lithium compounds anywhere in the world, there may be a shortage of mines and processing facilities.  Modelling this more than a three years out is impossible as we don't know which mines will come online and which will be cancelled.  One model both indicates a slight surplus in 2022, with deficits in 2023 and 2024 (Matt Bohlsen's Jan 2022 Model - paid link).

The Lithium Industry

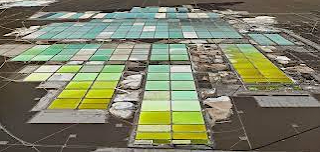
The traditional method of extracting lithium carbonate is from brine.   Lithium rich waters are pumped into evaporation ponds in the desert, and left to evaporate for 2-3 years.  The time taken depends on rainfall.  During that time production cannot respond to changes in demand.  This method is the lowest cost, accounts for around 35% of lithium production, and is used in South America.

The remainder is produced from hard rock.  Ore is crushed, then undergoes several separation processes to produce a concentrate.  This uses more energy and is more expensive, but takes less time.  Its used in Australia, which acts as the swing producer.

It usually takes 5-7 years to start up a lithium mine.  Sometimes up to ten years.

Future potential supply sources are:

Longer term, these may be a new supply sources, but I'm only looking until 2023/2024.

The Players

Albermerle:
  • The largest producer, with an estimated 22% market share.
  • Only 37% of their FY2020 revenue was from lithium.
  • They were profitable in a crappy 2020.  
  • Debt is around 4.5X 2020's CFO.
  • They regularly issue new shares.
The second largest producer, SQM, has too much exposure to Chile/Argentina with their new mining tax hikes.  I already have exposure to these through Lundin Mining and SCCO, don't want more.

GanFeng Lithium (HK:1772):
  • 3rd Largest Lithium producer, with an estimated 17% market share.
  • 75% of their 2020 gross profit and 86% of 1H21 gross profits were from lithium, the remainder from batteries.
  • Also profitable in 2020, excluding fair-value gains.
  • Debt is around 5-6X 2020 CFO.  A bit high, but not in any danger of going under.
  • Aggressive expansion plans to increase their capacity to 200,000 tonnes LCE per year by 2025.  Thats 4 times their 2019 production.
  • They regularly issue convertible bonds or new shares.
Both these companies are correlated enough to be pretty much the same trade.  With GanFeng being higher risk.reward:

Conclusion

When your'e buying into a growth industry, you can't value it.  I think the best you can do is:

  • Wait for the right time: when its plausible that demand could outweigh supply, and when risk-on assets are going up.
  • Buy something that won't go to zero.  Or if it can, position size appropriately.
  • Ride the trend.  Number go up.

Just to be clear, I'm not buying now.  Maybe in a few months.