Monday, November 30, 2015

Rickmers Marine

Rickmers Marine

A REIT-like structure, holding and leasing 16 panamax container vessels (3400-5000 TEUs). Their fleet is new: all but one vessel was built in 2007 or later, and they have a 25-30 year lifespan.

Rickmers stock price has plunged after it suspended dividends, due to lower revenue from declining rates.  How much of this is already built into the share price?

First off, Rickmers has a loan covenant waiver that they need to extend, due end of this year.  If they can't, all bets are off, and they'll have to sell vessels.

If they extend, then we value Rickmers by its ability to generate free cashflow and pay off debt.  Or maybe just survive.  Here's the relevant 3Q15 numbers for back-of-the-envelope calculations .

Income/Cashflows

  • Revenue 27m
  • Depreciation: 8.7m
  • Vessel operating expenses: 9.6m
  • Misc fees/expenses: 0.9m
  • Finance expenses: 3.3m

Vessel operating expenses seem to be pretty constant: they vary by at most 10% over the past 8 quarters.  Future revenue and finance expenses are the two big moving parts here.

Revenue has dropped as their fleet's long term contracts have expired. 11 vessels are now on short term contracts:

Three vessels we re-leased this quarter at around USD $6200, which is the market spot rate.  This rate has dropped sharply recently, and is now at the GFC levels of 08/09:

So everything depends on the rate.  In their 3Q conference all, Rickmers' management states that this rate is just above cash breakeven.

Container Shipping Outlook

Depends on demand and supply.  I can't find any optimistic numbers on the container shipping market:

a) Bimco (Nov 2015): 
  • Supply: Estimated new supply exceeds demolitions for the next few years:
  • Demand: In our last report we discussed if a potential gap in the market was the reason for 6-12 months’ charter rates for ships sized 1,000-4,250 TEU to significantly increase over the first five months of 2015. Today we can see half of the gain is now gone, and the rise in time-charter rates seemed to be more of a short-term imbalance rather than a long-term improved market.
  • In the 3,000-4,000 TEU segment...There is still more than sufficient supply of tonnage within this segment during the remainder of the year so we expect the rates to remain stable in the USD 6,000's depending on the exact vessel design. 
c) Rickmer's 3Q conference call:
  • More than 30 vessels are currently idle in Asia and ready to sail now.

Another trend is that new container ships are far larger (up to 20k TEUs), in a bid to drive economies of scale.  Some of the 3000-4000 TEU ships are now being used as feeder vessels (including the Laranna Rickmers, leased to Simatech).

Debt

They have:
  • 325m bank loans (USD Libor + 1.7%).  46.5m short term, 279m long term.  With 50m cash to offset the short term loan due.
  • SGD 100m (~USD 80M) "Series 1 Notes" issued May 2015 S100m: 8.45% PA, matures May 2017.  Currency risk unhedged now.
A large chunk is due in 2017: 


Their USD bank loans (in Q3 around 2+% interest) will have to be refinanced in 2017.  I would expect interest rates to be higher in future, lets say 3 or 4 fed hikes.  About 1% or so, giving a rate of 3+ percent (if they can refinance under the same conditions....the covenants).

But the loans come with restrictive covenants, and they may choose to refinance by their MTN program instead (of which only 100m out of 300m has been used).  This has a high interest rate at 8+%, and there is also a refunding risk every 3 years.  (I assume they would hedge currencies if they take on more SGD debt).

I calculate that, if the market rate stays at $6300/day, by the end of 2017, they need to refinance USD 135m plus SGD 100m.  Assuming they use the MTN and get the similar rates, thats about USD 17m per year interest.  Or 4.3m a quarter, an increase of 30% over 3Q15.  Manageable.  

Can they survive?

Probably.  It all depends on the rates.  If they plunge below cash breakeven by 2017, Rickmers may not be able to secure financing on favourable terms.  Or on any terms at all?  Either demand needs to recover, or ships need to be scrapped.

Historically, have container rates gone below cash breakeven for long periods before?  Need to do more research.

As value investors, how would we play a cyclical industry?  Wait for the industry to bleed for a while... my guess is - for long lived assets it will take years.  Then buy companies with strong balance sheets and cashflows, if any.  Easy to say, hard to do.

Monday, October 19, 2015

Rolls Royce: Aircraft and Engine retirements

Roll's recent profit warning was due to the transition from old engines to new one.  Old planes are being retired, reducing maintenance income, while Rolls is still waiting to ramp up production in new engines.

I need to get some idea of the numbers of aircraft being retired in the future.  Is there more to come?


First, lets look out the different aircraft models based on range and payload:


Ignore Narrow body aircraft at the bottom left, which are irrelevant to Rolls.

Jumbos, in the top right, are large 4-engined planes.  They are now a niche product: for polar flights, freight, or busy slot-constrained airports.  They are only profitable when full, which is risky for airlines as they can't scale down.  Passengers also prefer greater frequency with smaller planes.  B747s are being phased out for passenger use, and the is A380 only successfully used by mid-east carriers.

Soonest to be replaced will be the B747s and A340s, due to their fuel-guzzling 4 engines.  Followed by the B757, now also out of production.  They will be replaced by the B787, A350, future B777X and future A330neo.

Its not a 1-1 replacement.  Larger aircraft are more profitable (when full), but more risky to operate.  For example: an A350 gives better per seat fuel milage, but may be harder to fill, so could be substituted by 1.x B787's, allowing the airline to scale down the route when necessary.


How long do planes last for?  The lifespan of a Wide-body averages 25 years.  It depends on the individual plane's model and milage - some last 35 years.  Freighters tend to last longer.


(Source: Avolon white papers 2015 and 2012.


To estimate the number of aircraft retiring, I searched the www.airfleets.net production list for all aircraft in the "Wide Body" and "Jumbo" categories above.  I only took currently 'Active' aircraft, ignoring 'stored' ones and did not distinguish between passenger or freight (or the occasional military).  Then I added 25 years to the each plane's first flight year, to estimate when it would retire.  The resulting graph gives the number of Rolls Royce engines due to retire in red and non-Rolls engines in green:

Again, it is number of engines, not planes.  And its only a rough estimate, as each plane could retire up to 10 years earlier or later.  So we can't predict the timing of any more earnings surprises in the future.

What we can tell is:
  • The numbers expected to retire are around 50 engines from 2014-2016, 150 engines from 2018-2022, and 150-200 engines from 2023-2026.
  • The predicted retirements match favourably with engines coming on line in the next few years.  Around 780 A350's are on order, but their rollout is constrained by Airbus' production rate.  Its currently 3 A350's per month (i.e.: 72 engines per year), expected to raise to 10 per month (240 engines per year) in 2018.  And maybe 13 planes/month (or 312 engines per year) after that.
  • Plus another 350+ B787 planes (700+ engines) from the current order book, lets say over the next 9 years.
Based on the order book and the projected number of engines retiring, Roll's problems of retiring engines are temporary.  In the long run, there is no evidence that the number of engines maintained will drop, and it will probably increase.

Bought Rolls Royce

Bought another 2073 RYCEY ADRs, at $10.4255.  Total cost USD 21,621.

Thats priced at roughly 13X earnings.  Rare to find inexpensive blue chips in year 6 of a bull market.  Now I have a full position in this counter.

Now around 85% in cash.


Monday, October 5, 2015

Bought USD

In late 2011, I sold my Perth property and converted the money to SGD, because:
  • Commodity booms are cyclical, and we were 9 years into one.
  • The property's price had risen 4 times in 14 years, (non-mining) wages had only risen 50-100%.
  • I was expecting a recession.
The last didn't happen, and I was 2 years early, but the decision proved correct:


Today I converted a significant amount of SGD to USD.  This decision is a lot less certain.

Holding SGD is a little bit of a risk (not a lot), as its lumped with Emerging markets.  The risk is if China devalues the Yuan significantly, due to capital flight and the unwinding of the carry trade puffed up since 2008 by endless rounds of QE, and they start to lose control (1) (2) (3).  But holding USD is a risk if the US economy falls or if we get QE4....QE for-ever....

I don't know what will happen - Nobody knows nuthin'.  But its too much of a risk to hold all my money in SGD, better to balance a little.  Maybe I'm right.  Or maybe I'm the last sucker to make this trade.

Now I'm holding:


In the big picture, I'm still holding cash waiting for the stocks to fall.  And still avoiding commodity currencies like the plague.  Not trying to make money yet, just trying not avoid too much risk.


Friday, August 28, 2015

Rolls Royce: Cashflows

A look at Rolls earnings and cashflows.  Same as for any company I want to buy. 

Earnings vs Cashflows

First, ignore the Net Financing.  These contain large profits or losses from their currency hedges (mark to market), irrelevant to their underlying business.  All the earnings below exclude this.

Lets see how past earnings and cashflows compare:


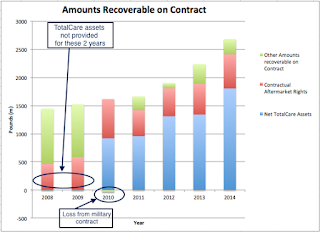
The stated earnings “smooth-out” the Cash Flow from Operations (CFO).  Sometimes they are higher, sometimes lower.  For the next two years, CFO is expected to be below earnings as large numbers of new Trent 1000 and XWB engines are built at a loss.  When this happens, revenue and profits from future maintenance and long term contracts are recognised at the initial point of sale and held on the balance sheet as assets under Accounts Receivables.  In detail:

All these assets are held under "Amounts Recoverable from Contract" under Receivables.  TotalCare Assets (in blue below) have risen to form the majority of these:


This is a risk, given given the uncertainty in estimating the revenue and costs of long term contracts.  Rolls gave an model example for a single contract (slides/transcript):


The resulting profit (and difference from cashflows) is modelled as:


The modelled profit/cashflows over the product's lifecycle (building many engines over the decades):

In Roll's 1H2015 presentation (p24), the cashflows for their newest engine show that they expect it may be a drain on cashflow for a few more years:


I don't think there is anything funny going on, but earnings will be below cashflows for the next few years, and I need to understand this if I'm going to hold the shares. As investors, we have no way of knowing how aggressive their accounting is.  Their accounting practices were reviewed by the FRC in 2014, where they agreed on the treatment of TotalCare.

The expected free cashflow for 2015 is between -150m to +150m (p17).  Essentially zero.  I'm guessing it may be negative for a few years after that.

There may be write offs risk if flight hours decrease suddenly (e.g.: SARS, financial crisis) or planes are grounded.  If that happened, I'd regret buying the shares before the write-off, instead of after.

Cashflow Generation

A look at Cash Flow from Operations and Cash Flow from Investments.  Major acquisitions/disposals and one-off events for CFI are annotated:


Both annotated acquisitions are for non-aviation businesses.  Without them, they would have generated cash every year.  Hopefully the new CEO will stop.

In the long run, ten years or so, if Rolls wants to develop a narrow-body engine, that would take considerable investment.

Conclusion

I like the company.  If the A350 is a success, earnings should trough in 2015, though free cashflow may be negative for a few years after.  Biggest risk is a recession, financial crisis or SARS/911 type of event, which could affect their revenues and may lead to write-offs.

Saturday, July 11, 2015

US Natural Gas (part 2) - valuing Advantage Oil and Gas (AAV)

Continuing my previous Nat Gas post.   Steps showing how I value Advantage Oil and Gas, a low-cost Canadian natural gas producer.  Since Natural gas prices are highly cyclical, I am trying to normalise them based on the futures market (see Market Based Forecasts here in a paper by Aswath Damodaran).  The futures market is best predictor of market prices as they know more than anyone else.

Heres the details:
  • What are AAV's realised prices compared to the benchmark?  The company gives their realised price and the AECO price (in CAD/mcf) in their quarterly results:

          Showing just the discount:


          Around 0-30 cents.  The discount to the Benchmark is pretty small, unlike in the Marcellus.  Sometime even negative!  Lets take 20c.  Though theres a risk that the discount may widen if too many companies start producing in the low cost Montney area.
  • Look at the Natural gas futures prices.
         Source - gasalberta.com (as of 6-Jul-2016).  Great source for simple AECO and NYMEX prices.
         AECO price is in CAD/GJ, which is approximates very roughly to CAD/mcf (100 GJ = 94 mcf).  So multiply by (100/94) to get mcf price.
  • Look at AAV's projected production.  In 2017 they project 245 thousand mcf/day, which is an 1.83 times their 2015Q1 daily production.  From the above futures chart, CAD 3.07 (per GJ) is about CAD 3.26 per mcf.
  • Based on their 1Q2015 profits, project what their profits would be at different gas prices in 2017.  I am using a discount of 20c.  Usually I would go through the income statement and guess which of their costs are fixed (e.g.: General & Admin) and which are depend on production volumes (e.g.: operation expense, DD&A).  But for AAV it didn't make much difference (mostly variable costs), so I just multiplied their profits proportional to the expected production increase.  I get:

Highest I can get is CAD 3.90 at the 2019 price.  At USD 6 plus (~ CAD 7.80) , the stock is overvalued. My ballpark figures can't even get close.

[Edit: 4th Aug:
   Producing gas cheaply is not enough, you also have to deliver it to customers.  Canada has a small population of 35m.  Monty, in West Canada, has historically exported gas to East Canada and the NorthEast US.  Both are under threat by prolific US production there, especially in the Marcellus.  I think that Canada's Montney gas production will rely on LNG exports to Asia.
   Thats a big uncertainty. I don't know enough about the industry to buy gas producers in a new emerging area.]

Price/EBIDTA or Price/Cashflow

Most analysts I've seen use price/EBIDTA or Price to Cashflow (not sure which cashflow...) to value Oil and Gas E&P companies.  You get much lower multiples, because these denominators exclude Depletion, Depreciation and Amortisation (DD&A), which is the largest component of costs for most Oil and Gas companies.  For AAV's 1Q 2015 results for example, DD&A was around 2/3rd of their expenses:


It doesn't make sense to exclude DD&A from the valuation, and also exclude the Cash Flows for Investment needed to drill new wells to make up for the depletion.  Especially when shale wells deplete so rapidly.  For example, AAV's 2015 June investor presentation (p5) shows hyperbolic decline curves for wells drilled in different years:

I cant see why analysts use price EBIDTA or price/cashflow metrics.  This applies to all oil and gas E&Ps, not just AAV.  I just don't get it.

Thursday, July 9, 2015

Sold Kweichow Moutai

Sold my holdings, 900 shares @ CNY 244.  Profit ~ SGD 15.5K.

Why did I sell?  Its a toss up between:

  • Hold, because its a good company at reasonable valuations and good long term growth potential, and I've got nothing else to buy.
or
I don't think any bursting bubble ever has ever been successfully averted up by a government anywhere ever.  The only way they could do it - and its just possible in China - is to order the banks to print money and buy whatever price the market offers.  They will do whatever it takes.  See the nice chart here.

Hope that, after the carnage, I can buy back at a cheaper price later.

---

I'm now 91% in cash.  Buffet said it best - like an oversexed guy on a desert island.  Still nothing to buy.


Wednesday, July 1, 2015

US Natural Gas

US Natural gas prices have been low since 2008, and are now below the cost of production.  When this happens to a commodity, eventually either its price must go up, or the the cost of production must drop.  The usual value-investment strategy is to buy a lost cost producer which can outlast the competition and will benefit when the commodity price rises later.

In short: I think US Natural Gas prices will rise soon due to falls in production.  But I could not find a stock reasonably priced enough to bet on this.

Natural gas pricing

Since natural gas is difficult to transport and impossible to store, it price is set regionally, not nationally or globally.  US Nat Gas prices reference the Henry Hub (Nymex) price, and gas sold by companies in gas producing areas is sold at a regional discount, reflecting transport costs and the area's supply/demand (gas produced vs outgoing pipeline capacity).   The discount changes over time, for example, in the Marcellus, Cabot had a discount of 10c to 30c in 2013, and 89c in 2Q14.  The Marcellus differential for the last year seems to be around 80c to $1.40 - see the 2 NGI charts here.

One note for calculations: the Nymex price is in btu, but most companies provide their average realised price in mcf.  There's no way to convert between the two.


Production Costs

What is the cost of production, and how do we find the lowest cost producer?

Commodity companies always provide their own version of production costs (e.g.: C1 costs, cash costs, extraction costs, half-cycle costs) in presentations.  These exclude Depreciation, Deletion and Amortisation (DD&A),  General Administrative (SG&A), interest, and sometimes royalties.   Ignore all this rubbish and just use the expenses from the income statements instead.  Use the latest quarter, because the gas industry costs change so fast. Strip out hedging (derivitives), one off costs (e.g.: litigation) or irrelevant costs (transport of 3rd party gas).  Subtract Oil and liquids revenue from the gas production expenses based on whatever price they realised that quarter.  After this, we can get a breakeven cost of gas per mcf.

I checked the 2015Q1 income statements of 7 US/Canadian companies.  Only three were were making money unhedged:


This was period included the Q1 seasonal price spike - so I'm sure that overall production costs are higher than the market price.

Demand vs Supply

US production is around 70-75 bcf/day.

Only one area, the Marcellus has rising - almost exponential - production.  All other areas are flat or declining - See this nice 2013 map and graphs.  Although the Marcellus has the lowest cost of production, it also has the widest differential to Nymex pricing.  There are some indications that national production will peak or decline this year:
  • 2 articles (1) (2) by Bill Powers: the states' Department of Natural Resources and Texas Railroad commission data currently shows flat or falling output.  EIA projections of output increases are wrong.
  • Several companies have indicated flat or lower production in their 1Q 2015 earnings calls. Cabot stated they will reduce their Q2 production by ~10% sequentially, and "continue to monitor the price environment before we make any decisions on selling more gas into the local market".  Chesapeake stated that they shut in some production from December onwards, Q1 Marcellus production growth was "pretty well flat", and they intend to maintain this (albeit with the ability to quickly grow if prices rise).
Couldn't find a cost curve for natural gas.  There's too many players, and the production costs keep changing due to technological advances.

Shale gas wells have a high initial decline rate (See first graph in the first result here), like shale oil.  So we can't ignore DD&A - it represents money that needs to be ploughed back into drilling new wells as current ones decline.

On the demand side, natural gas is in a secular uptrend, due to the fact that its been cheap for so long, and as a lower-carbon replacement for coal.  Everyone knows it will will always be cheap.

Company valuations

The cheapest producers are Advantage, Cabot and Chesapeake.   Southwestern is also profitable, as it gets a higher realised price as most production is outside the Marcellus.

To value a company: I pick a what I think the long term average commodity price should be, project their earnings for that price, then apply a PE ratio to that.  I'm picking a NYMEX price of $4 (roughly $4/mcf on average) - just a guess since I have no cost curve.  I also pick a PE of 12.  Theres nothing magical about that number, but thats where I'd be comfortable buying and holding long-term through hell or high water.

Cabot

Targets "close to 3 Bcf per day by end of '17".  At a realised price of $3.80/mc ($4 NYMEX and an optimistic 20c discount), I get an annual EPS of $1.80, giving a target price of $21.6.  The stock is now too expensive.

Advantage

Targets 245 million mcf/day by end 2017.  At a realised price of CAD 4.50 (approximately USD 3.60), I get an annual EPS of CAD 0.75, giving a target price of CAD 9.00 (or USD 7.18).  May be worth investigating further.

Chesapeake

Although they have a low cost of production, they also had a terribly low realised price ($1.61 vs Cabot's $2.23).  They gave no reason why: "This was primarily the result of weaker Marcellus Shale basis differentials in the Current Quarter compared to the Prior Quarter and increased gathering and transportation costs. "  Cabot also operates in the Marcellus.  The difference does not seem to be permanent: in 1Q 2014, their realised price was  $3.86, better than Cabot's $3.74.  In between then, they sold off a lot of gas producing assets.  Lets see if their realised prices improve first.


Saturday, June 6, 2015

Update on Kweichow Moutai

Moutai stock price is up 130% from its 2014 bottom, and 50% from when I bought.  Two reasons:

  • Good Q1 results: revenue up 15%, operating profit up 30% and EPS up 21% (due to share dilution).  No increase in receivables.  Perhaps the start of a new uptrend after two years of stagnant results?
  • A frenzied bull market in China stocks, encouraged by the government.  Mostly driven by retail traders.  And no one knows how much leverage.

 (Banana seller trading - ZeroHedge)

Moutai is not up for the reasons I bought it.  But better to be lucky than smart.

My gut feeling is that the bull market will continue, as the government needs it to paper over their other problems, take over from their housing bubble, and possibly raise capital for their banks. But expect 10-20% corrections as it pauses to let some air out.

Small caps have been the target of the frenzy, not Moutai directly.  Large caps may benefit from upcoming inflows from foreign ETFs such as Vanguard.

The China bull market has been crazy - no point trying to predict when it will end.  Moutai is still trading at reasonable valuation (~16 times expected 2015 earnings), with excellent cashflow and balance sheet.

I'll hold for now, given its a small position, and the risk reward balance is favourable.  But keep in  mind that all bubbles end.  When it pops, I may not be able to get my money back due to the Shanghai Connect daily quota limit.

Thursday, May 28, 2015

Sold Dragon Oil (LSE:DGO)

Sold all my 1700 shares at 687.50p on 26th May.

The majority shareholder ENOC indicated in March that they would make an offer, finally mentioning a 735p price on the 21st of May.  Not as much as I'd hoped, and the market seems doubtful the bid will go through.

ENOC is a refiner who badly needs E&P capacity to sell oil domestically.  A previous opportunistic bid in 2009 was defeated by minority shareholders.  Don't know what will happen now - the takeover may fall through, or they may increase the price.

This company is not a long term investment, despite the good numbers.  "Oil" and "Turkmenistan" make it too risky to build a meaningful stake.  Don't want to be left holding it if the takeover falls through.  Better to sell now for a quick 20% gain.

Profit is SGD 4437.43, including dividends.  Right now, the results, and the process - being able to wait for a commodity to become undervalued, find ways to invest in low cost producers while managing risk, and waiting for the payoff - mean more than the money does.  Prove you can make a plan and follow it.

Incidentally, Turkmenistan's president just unveiled  a 65ft high, 24k-gold, overcompensating statue of himself riding a horse.

Monday, April 20, 2015

Bought Rolls Royce (RYCEY)

The idea for buying this is clearly explained by Bronte Capital here and here.    It depends on the success for the A350, the B787 Dreamliner (Rolls has about a 30% engine share) and the upcoming A330neo (expected end 2017).  The main competitor for the A350 is the B777X, expected in 2019.

Based on their order numbers for the Dreamliner (~300 planes), A350 (~800 planes) and the a330neo (~140 planes), with Airbus’ expected A350 production rate, I’m guessing a large ramp-up in 2017-2019 (190 planes in 2017, 240 in 2018 and 2019).  The company provided slightly more optimistic charts:


(Source - June 2014 presentation - p21&22)

Roll’s civilian aerospace 2014 income is about 50% recurring (services) and 50% project based (OEM).  The industry is a simple duopoly.  The only risk I can see is something unexpected happening (e.g.: SARS, 911, financial crisis), or the end of a typical expansion cycle where everyone realises too late that the’ve all added excess capacity.  This would affect Roll’s OEM revenue as orders are cancelled, and their service revenue (power-by-the-hour) shinks as revenue/profits are recognised based on expected flight hours.

Underlying PBT guided for 2015 was 1.4-1.55bn pounds, giving at the lower bound, an EPS (before tax) of 73.9p, or EPS (after tax) 56.2p.  At 900p, thats a PE of 16.


The idea of RR selling its under performing assets (1), (2) is unlikely due to the UK government’s golden share.

For me, the potential reward os worth the risk, after buying I'll still be 78% in cash.  Hard to find anything to buy.


Bought 304 RYCEY ADRs at USD 73.0955.  Total cost was USD 22,229.98.

Paperwork stuff:
  • One ADR (RYCEY) equals 5 LSE shares.
  • Later on, check my dividends to make sure the are not taxed: UK shares should not be, neither should their ADRs. Check the fees BNY Mellon charges (should be 1-3c/share) for the dividend payments.
  • Held in my Schwabb account.  Should be a long term holding.  Counterparty risk through Schwab and BNY Mellon.  No way to avoid this for UK shares unless opening a CREST acct.

Sunday, March 15, 2015

Sold IEO, Bought Genel

Sold 300 IEO shares on Thursday night at $70.85.  Total loss was USD 1042.34.  Only bought them to have some exposure to oil when I couldn't find any stocks to buy.

Bought 1800 shares of Genel at 515p on Friday afternoon (London - Friday morning).  Total cost was SGD 19,393.51.  They dropped 3% in that session.  Shit!  If only I'd waited a little longer.  At 515p, I value them at 12x earnings (@ $70 Brent), excluding failed-exploration costs.

Friday's session was terrible for oil: WT is retesting its lows at $44, Brent closed at $54.64, may soon retest lows around $50.

Still think oil will recover by the end of the year as marginal shale producers go belly-up and cut production.  Providing there is no recession.  Am 40% invested and looking for more companies to buy. US shale producers are still expensive - they did not drop much on Friday.

Thursday, March 5, 2015

Genel 2014 results and Valuation

Genel Energy released their full 2014 results today, and the stock price has shot up 10%.

Guidance for 2015 is for $350-400m revenue (at $50 Brent), and a 38% increase in production volumes.  Based on that, I estimate 2015 profits to be 26c (or 17p) profit per share, using generous assumptions:

This would give a high PE - fair enough in a cyclical industry.    What if we adjust for a long term price of Brent $70?

  • From their 14th May 2014 Investor presentation, and after going through the flowchart (p38)  Genel's revenue rises/falls by around 6% for every 10% rise/fall in the oil price.
  • So an 40% oil price increase to $70 Brent would give a 24% increase in revenue, to $496m.  Profit would be 60c or 40p.  At a share price of 600p, thats a PE of 15.  Not cheap.  And with a few unrealistic assumptions.
What am I missing?

Monday, March 2, 2015

Bought Dragon Oil (LSE:DGO)

2nd Mar 2015 - Bought 1700 shares at 541p.  Total cost: SGD 19.833.97

Held in my DBS Vickers acct.

Brent was around $61 when I bought.

Saturday, February 28, 2015

Dragon Oil (LSE:DGO)

Dragon Oil is the largest oil producer in Turkmenistan. All their commercial production is from their Cheleken Contract Area in the Caspian Sea, consisting of the Zhdanov and Lam fields.  The contract lasts until 2025, with rights to negotiate a ten year extension.


In December 2014, oil was found in Iraq; expected to take 2 or 3 years to determine if commercially viable.

They are also performing exploration in Algeria and Egypt.

Revenue (Production Service Agreement)


Their Cheleken PSA entitles Dragon to 50% of the oil found over the life of the contract.  In the short term, that percentage varies depending on opex and oil prices.  Entitlement in 2013 was 44%, 2014 was 56%, and 2015 is expected to be 65%.  Dragon also has to pay some taxes on profit as part of the PSA.

I could not find any other details or a copy of the PSA.

The PSA seems to be frequently amended.  In December 2014, after the oil price fell steeply, taxes were reduced from 25% to 20%, to be replaced by an additional flat $10m to be spent on social and training projects.

Reserves

The company only gives 2P reserves (50% confidence level of recovery).  Dragon Oil concentrates more on production than exploration - Over they long term reserves are flat:


But they have been decreasing in the two years: 93% replacement in 2013, and 60% replacement in 2014.  Their reserves may be fluctuating based o oil prices (?)

Costs and Breakeven

Look at their break-even costs per barrel.  Use all costs on the income statement, except for taxes (not required if making a loss):


In 2009, management stated (p11) they has break-even costs of between $25-30/bbl.  Cash costs consist of in-country operating costs of $4-5/bbl, G&A costs of $2-3/bbl, and marketing/transport at $2/bbl.  Add depreciation of $16-17/bbl.  The resulting $25-30/bbl cost is close to my numbers.

They sell at a discount to Brent, on an FOB basis.  In previous years the discount was typically 14-18% of the price.   In 2015, the discount negotiated is a flat $14/bbl.  So the final 'all-in' break even price, conservatively, is $44 Brent.

Balance sheet

At end 2014, net cash is use 1.9bn, or USD 3.93 per share (roughly 255p).

Management stated they hope to make acquisitions in 2015.  No special dividend is planned.

Valuation

Assuming Brent $70 with some reasonable assumptions, I get a PE of 12:


Due to majority ownership by ENOC, this firm cannot be a takeover target.

Trailing dividend yield is 36c, or 23p, or about 4% at a share price of 550p.

Risk

Turkmenistan is a dictatorship and one of the worlds most repressive countries, with leaders that have built cults of personality around themselves.  Do you really want to invest money in a country that erected gold plated statues to Glorious Dear Leader?


Summary

Excellent numbers from a company generating free cash-flow from a low cost resource base.  Good valuation.  Limit any investment to 2% due to the geopolitical risk.

Wednesday, February 4, 2015

Bought IEO

Bought 300 shares of IEO, at $74.19 each this morning.  Total cost USD 22,311.

WTI was ~ $53 when I bought.  I guess its long term sustainable price to be $70 - seems to be the consensus view too.

Its 1/3rd of my intended position. In case this week's breakout was real.  I'm always uneasy buying on breakout, because it comes from fear.  Fear of missing out.  My old broker used to say "Never chase".

If this breakout is fake, and oil goes down to the forties again, then I hope to accumulate at better values.  If not, today's trade may give me a consolation prize.

Sunday, February 1, 2015

Oil ETFs

I believe oil is priced below its sustainable price.  Beyond buying a few barrels to store in my flat, how can I invest in it?  All the individual companies I've looked at are not at low enough valuations for me catch a falling knife.  What about ETFs?

Oil commodity tracker ETFs, such as USO, are synthetic, since its hard to physically store  oil.  They suffer from large tracking error when the market is in contago, as they have to regularly roll over their (cheaper) expiring near term futures into longer term (expensive) ones:

(Source - bidnessetc.com - Seeking Exposure to Oil and Gas prices?  Here is what you should not do.)

ETF tracking Oil companies are better.  But most common ones, XLE or VDE, are heavily weighted towards large caps (with 22% ExxonMobil 22%, and 12% Chevron).  Looking at Jim Chanos' recent short position in XOM, I'm hesitant to bet against him.

XOP, tracking the "SPDR S&P 500 Oil and Gas exploration & production index" may be a better choice to track the WTI.   It is split by equal weightings into 80 companies, each less than 2%.  Holdings are 100% US based, around 77% are E&P.  They are all small E&P companies such as Laredo Petroleum or Parsely.  The top ten holdings make up 15%.  The risk here is that a large number of these companies go belly up -  based on 1-2m bbl/d oversupply on the global markets, US shale production needs to drop by 10-20%.

IEO, the "iShares U.S. Oil & Gas Exploration & Production ETF" is another option, which holds mostly mid-sized companies such as EOG or Andarko, with 73% E&P, also 100% US based.  The top ten holdings make up 60%.  IEO behaves as a lower beta version of XOP - they both track WTI, but IEO rises and falls less.

I'm thinking of taking a third of my planned position by buying IEO at the WTI support of $44 - too bad I missed Friday night (morning in US). Later buy another third if WTI drops below $40 - hopefully by then, valuations are down enough for me to buy individual stocks.  And then I may swap my initial IEO position into a higher risk XOP one.