Monday, December 26, 2011

Stocks I don't like

As a value investor, looking to buy solid, undervalued stocks when the markets go into a tailspin, these are the things I avoid.

Technology

Building a sustainable competitive advantage is meaningless in the tech sector, where industries quickly change to become unrecognizable. So I would not buy technology stocks based on low valuations or high market share (e.g.: Microsoft and Cisco today, Nokia several years ago). If I was to buy tech, it would be as part of a growth strategy: in a bull market, with a stock at all times high, with growing sales and their new products that are changing the world....just remember to leave once the party is over: today's hot product is tomorrow's junk....

I also like the idea of avoiding any product/service whose input and output is information (See 'Software eats part of the world'). e.g.: credit cards, newspapers, TV, bookstores.

Change is bad for value investing.


Banking and Finance

Banks are a black box. They make money by lending it out and hoping people can pay back. There is no way to judge the quality of earnings from their cashflow statements. In addition, banking crises occur regularly enough that we can consider them a part of human nature.

So for a long term investor, don't buy when times are good, as the next crisis will hit and drive down the share price of your bank. And don't buy when times are bad, as they can go to zero. Bill Miller beat the S&P for 15 straight years, then in 2009 he "bought ‘cheap’ financials after the credit crunch, but later they got even cheaper". Like Bear Stearns and AIG. He resigned a few years later.

Investment banks are worse, some seem deliberately designed to store risky assets until they blow up.

How do you know which banks are good and which are bad? If Bill Miller and GIC cannot get it right, what makes you think you can?

REITS

I've two main objections to REITS:
  • First, Singapore Reits must payout 90% of their income as dividends. So they are in perpetual debt. Meaning that you are taking for granted low interest rates and access to finance....forever. Ironically, I think they would be better long term investments if they could use their income to payoff their debt.
  • Second, how many REITS bought property at low, low prices during the 08/09 market crash? I cant think of any. A-REIT even made a rights issue at the bottom of the downturn. Some people may even get the impression that REITS are not run to benefit their shareholders.

Sunday, December 18, 2011

Stocks I'm interested in

Still waiting for a recession, and drawing up a list of stocks that I want to buy. And others that I still have to look in to (*).

Dominators: Buffet-like companies, with large market share and only a handful of competitors, these companies have a sustainable competitive advantage in their industries. These stocks will never go to zero, and could rise 50-100% from bear market trough to bull. Might be possible to hold these stocks forever:
  • Coca Cola: Buffet's largest holding. Strong distribution network gives it a moat.
  • UPS: Only a 2 or 3 competitors worldwide, and one in the US. Buffet also holds some.
  • Diageo: Largest spirits producer in the world , and a cashcow; sales nearly double its closest competitor.

Local Blue chips: Big players in Singapore or the region: Also will probably never go to zero, though they do not have a sustainable competitive advantage. Usually rise 50-150% from bear market trough to bull:

  • Diary Farm: Large player in Asia supermarkets & convenience stores. Low debt, generates cash.
  • SIA Engineering (*). Or maybe STE (*).
  • Raffles Medical Group (*), or possible its overseas competitors (eg: The hospital in Thailand...).
  • A property development company (freehold property only): Wheelock, SC Global (*), or CDL (*). Wheelock has historically been the most astute in its timing, but has been doing nothing for the past few years. Check the others, esp. their debt, and how their properties are values on their balance sheet.
  • Eu Yang Sang: Low debt, and a long history of being profitable and generating free cashflow.
  • Goodpack (*): Large share of natural rubber shipments, and gaining share in artificial rubber. Has it started generating free cashflow yet?

Small fry. Risky, but I try to target those with few competitors and good balance sheets, to avoid the ones that go to zero. These are also very illiquid. May rise 2-4 times from bear to bull.

  • Petra: Love their branded consumer distribution, as a producer and distributor of Chocolates in Indonesia. Not so keen on their cocoa processing.
  • Silverlake Axis (*): Handles a large proportion of banking transactions in SEA. Clients have long term (3-5 year) maintenance contracts, giving a stream of future profits.
  • HDD industry: There is a small company which makes a large percentage (worldwide) of the HD actuator arms - forget its name (*). Alternatively, Seagate may be worth looking at. Always a large risk of obsolescence when buying tech: this is a bet that HDDs will still be around to hold information in the cloud.
  • 2nd Chance Properties (*): Plans to change to the property business, by buying commercial property in a downturn. Interesting idea, though I have not looked at the company yet.

Punting:

  • China Mingzong. Currently selling at 5X earnings, (as far as I can make out) in a non-cyclical industry. They don't have pricing power, but their industry should grow. Largest competitor may be a fraud, no guarantees about this one either. May buy a little with money I can afford to lose in the hope it goes up 5-10X in the long term.
  • AirAsia: Don't know where to classify this one, they are in a new industry...in fact they are the industry - no one seems to be able to replicate them profitably after years of trying. But they have fuckloads of debt and unimaginable future capital commitments.
Lets see if 2012 brings a chance to buy....

Saturday, December 17, 2011

Diageo (DGE:LSE)

World's largest spirits maker. They make Johnnie Walker, Smirnoff, Guinness, Baileys among others. Most of their products are number 1 or number 2 in their markets:

Competitive Advantage

Diageo's worldwide sales are twice that of their nearest competitor, Pernod Ricard. The third (or forth) largest producer, Barcardi, is privately owned and does not disclose sales. Next come 'Brown & Foreman', and Beam (formerly Fortune Brands), which have 1/3rd or 1/4th of Diageo's sales.
Notes:
  • Diageo reports in Pounds, currency conversion values above from here and here.
  • Diageo owns 1/3rd of Moet Hennessey.
Diageo's margins seem slightly lower than their competitors:
Notes:
  • All exclude excise and corporate taxes, except possibly for MH.
  • All include discontinued ops except Beam - the difference is negligible
MorningStar believes that Diageo has a strong distribution and sales network in North America (33% of sales, 44% profit in 2011), "resulting in operating margins in North America in excess of 35%, well above the firm's consolidated margin in the high 20s, and higher than most of its competitors."

Cyclical

From the above graph, operating Margins of all companies were affected by the 08/09 recession.

Sales did not fall however (Organic sales growth of zero in 08 and 2% in 09). Organic sales generally rise by high single digits (5-8%) during good times.

Business Model

The company is a cashcow, regularly generating profits and free cashflow year in year out:

How much of their costs are fixed, and how much variable?

From the above graph, many of their costs seem seem to be variable, not fixed:
  • I'm not sure how staff costs can be variable.
  • For marketing: I guess when times are bad, advertising is cheaper.
  • Cannot tell what their 'Others' cost is. 2009's dip can be partially explained by a 1bn loss from the Pension scheme.

This an asset light business. There's very little depreciation or operating leases, and most of asset are brands (intangibles).

High inventories:

  • Morningstar notes that: "About one third of Diageo's volume ... is derived from maturing products, which can sit in inventory and age for up to 30 years. ... Diageo expenses these input costs on an actual usage basis, meaning that it could be 10-30 years before today's cost inflation affects the income statement. Therefore, we suggest investors look closely at cash flow in addition to earnings when valuing Diageo."
  • They have about 2.7bn of Maturing Inventories, over 80% of it intended to be held more than one year.
Beyond future 0-8% organic growth, acquisitions are required. Diageo looks for companies with "strong local routes to market":
  • Worldwide: MH is most desirable, but not for sale. Diageo is currently negotiating to buy Jose Curevo.
  • Diageo is restricted from entering into Tequila, Cognac and Chapagne, due to their agreements with HM and Jose Curevo. There may also be anti-trust restrictions if it ends up owning to many popular brands in the same category.
  • Recently bought a 23.6% stake in Halico, Vietnam's leading spirits maker for £33m. Bought Mey Icki, which controls 80% of the market for Raki, at £1.3bn, at 9.9 times 2010 EBITA.

Balance Sheet

£6.7bn long term debt. Slightly over 3 years profit (before-tax).

Pensions liability underfunded by £838m as of June 2011:

  • Their actuarial assumptions (p130. eg: salary increase, inflation) look OK.
  • Discount rates are 4.9 to 5.7%. About 40% of the fund is in equities, with an expected return of 8.3%. Probably OK.
  • The group expects to make 163m contributions in 2012.

Negligible operating leases: 368m over the next 5 years.

Cashflows

Net Cashflow from Operations (basically CFO minus tax and interest) is usually higher than their reported profit. Outlays on Cash Flow from investment are usually quire small:

Conclusion

I would buy in a recession.

Saturday, December 10, 2011

SG Property Development Rules

New (and existing) rules applying to property developers (BT Fri 9th Dec, front page, Kalpana Rashiwala).

Old rules:
  • Any developer buying a Government Land Sale (GLS) residential site had to complete development in 5 years (no time limit on sales).
  • When buying a private sector residential site, foreign developers have to obtain a Qualifying Certificate, which requires 5 year limit for the TOP (development) and another 2 year limit on sales. Any developer with even a single foreign shareholder is considered 'foreign', hence CDL, Capitaland & Wheelock face these limits. Only local, privately owned developers (Far East, Hoi Hup) were except.

New rules:

  • For any site bought after Dec 8th, must develop and sell all units within 5 years. Otherwise they must pay a 10% additional buyer's stamp duty (ABSD) at the end of the 5 year period (with interest).

My thoughts:

  • Levels the playing field between private and publicly owned property developers.
  • Forcing developers to sell during a downturn may exacerbate it. Every last unit must be sold within the timeframe. Would these measures be removed? Retroactively?
  • I used to like Wheelock due to their astute market timing. As they have no undeveloped property in its landbank: they are now restricted to developing and selling any new land withing 5 years (previously it was 7).
  • SC Global may benefit, as they have a large bank of prime freehold land bought before the restrictions came into force.

Friday, November 25, 2011

LVMH

Worlds largest luxury goods seller. 2010 revenue/profit breakdown:
  • Fashion & leather goods (38%/62%)
  • Wine & Spirits (16%/22%)
  • Perfume + cosmetics (15%/8%)
  • retailing (27%/5%)
  • watches + jewelry (4%/3%)

First we look at the first 2 segments separately.

Leather and Fashion

I never imagined that I would ever, in my entire life, see a line of people queuing to shop for thousand dollar handbags.

It is difficult to convey how luxury goods are a part of everyday life here. The car you drive, the watch or clothes you wear, do really mean something. Women can instinctively identify a myriad of branded handbags, jewelery and watches at a glance.


The book "The Cult of the Luxury Brand", believes that Asian countries follow a model in their adoption of Luxury goods; the final stage is where Japan is now, where it is a 'way of life'. They write about the ubiquitous LV in Japan: "It is well past the stage of a trend, it has become an enduring requirement - like sushi or green tea - essential to the Japanese way of life...the company has taken the trend to conform to its logical end: To be Japanese means to have a Louis Vuitton bag. The brown bag with the original monogram pattern and pale leather trimmings has come to define the Japanese national identity."

In short, luxury goods are not a luxury. They are a part of everyday life. From junior office ladies to tai-tais, many people here must have them to function in society. This bodes well for the continuing consumption of luxury goods, which can be supercharged by an emerging China and India.

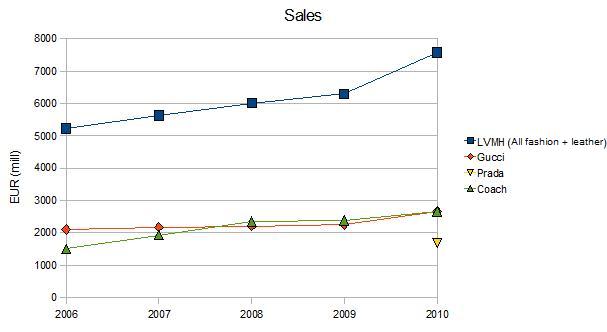
Comparing sales and profit margins of other brands with LVMH is hard, because LVMH does not break down sales for the many brands they own (LV, Fendi, Donna Karan, Loewe, Marc Jacobs, Celine, Kenzo, Giovenchy, Thomas Pink, Pucci, Belutti, Rossimoda). The chart below show show the total amounts for 'fashion and leather' for LVMH, compared with individual brands for other companies (so not really an apples-to-apples comparison):

From the above, their flagship LV brand, has, at most, twice the sales of the nearest competitor.

[For Coach, converted to Euros at a rate of 1 USD = 0.7394 Eur]

LVMH's margins are among the highest in the industry, only occasionally surpassed only by coach. The LV brand itself would probably have even higher margins, as they are lumping in all brands together.

LVMH's 'leather and fashion' revenue did not fall during the 2008 crisis. It may have been due to China, LV did not break down the figures.

Wine & Spirits

2010 revenue and profits are split evenly between "Wine/Champagne" and Spirits.

The champagne market is highly fragmented, with many producers. This article (free here) puts MH at an 18% global market share. It also discusses how MH is trying to tie up supplies in the (govt mandated) champagne growing regions. I would put MH as the largest player in a fragmented field, but with no real dominance or pricing power.

The champagne/wine market is highly cyclical, as with any commodity that has a fluctuating price and takes time to grow. e.g.: champagne grape glut in 2009, wine grapes in 2003.

For spirits:
  • MH trails the largest playes in the spirits market (2010 revenue: 3.3 bn Euros). The largest player is Diaego (revenue: 15 bn Euro) and Pernod-Ricard (June 09 revenue: 7 bn Euros).
  • MH's products do not appear in the top lists for spirits.
  • HM has a 44% share of the cognac market. Cognac went out of fashion in the early 90's, but is now revived due to rappers and China.

HM is not a leader in this market. The Champagne market is highly cyclical. And the spirits market is subject to changing fads and fashions.

Business Model and Risks

For the company as a whole, about 10% of their revenue is spent on advertising.

In the luxury goods business, the main aim is to develop a 'buzz'. Usually done by having celebrities and A-list people wear your products, appear at your parties, etc. This creates a fashion, which people talk about and want to imitate. This 'buzz' is the heart of the luxury goods business - it feeds it and is fed by it. I'm not sure exactly what creates it, but its more than throwing millions of dollars at advertising.

LVMH's income statement is quite sketchy: cannot tell how much of their costs are variable and how much are fixed. The financial statements are short: LV does not even break up their sales/margins by brand; contrast to Coach for example, which provides same store sales.

The chairman, Bernard Arnault, owns 47% of the company and has direct control. Two of his five children currently work there: Antoine Arnault has a management role and is on the board of directors, Delphine Arnault is a director, and nephew Harry Seaman may be involved as well.

LVMH owns many unrelated businesses. Ranging from a stake in Hermes (designer bags costing 50K), to cosmetics retailer Sephora (similar to 'Watsons', but for cosmetics), to Charles & Keith ($30-$40 women's shoes). Does not seem to have any focus. Combined with their sketchy financial information, makes it hard to track.

To conclude:
  • LVMH's main business is Fashion and Leather goods. The others are just sidelines or distractions. And are in more competitive markets, so unlikely to make the same margins as leather goods.
  • This is the only area they have have a competitive advantage in. The LV brand probably sells twice as much as its closest rival, and has the industry's highest operating margins.
  • This market has the potential to boom, thanks to China/India.

I'm not sure if I'd be comfortable buying this stock.

Friday, October 28, 2011

United Parcel Service (UPS)

The largest delivery company in the world. It is still quite dependent on the US: 60% of revenue and 57% of profit came from domestic operations in 2010.

Their segmental results are broken down into:
- US Domestic (ground delivery of letters or packages, both sending and receiving in the US)
- International Package
- Supply chain and Freight (Truckload (TL) and less-than-truckload (LTL) deliveries) - in the US and surrounding countries)

Competitive Advantage

DHL wrote off 3.9bn when it exited the US domestic market in 2009. Fedex and UPS are the only 2 large players left, and are compared below.

First, market share. UPS has larger (about 80% more) revenue for US deliveries. They both have similar revenues for International.
'International' here means the package was sent to *or* from the US.

Next, margins. This is difficult because both companies break down their segments differently. Fedex breaks down their margins into 'Express' vs 'Ground' (disregards if the packages are domestic or international):
We can see that:
  • Ground handling has a lot higher margins than express.
  • Express margins are more cyclical: were worse hit by the 2009 recession, due to falling revenue (Express fell 8% from 08 to 09, vs a 4% increase for Ground).
UPS breaks up their segments differently. Each of their 'Domestic' and 'Intl' segments is a combination of express and ground. Their 'Domestic' was an even mix of express/ground in 2010. Express has made up a larger and larger proportion of the mix since 2007.

We can't compare directly to Fedex due to the segment differences.

UPS has significantly higher margins overall. Morningstar says this is probably because of 1) their integrated network (same network used for both express and ground delivery, unlike Fedex, which uses separate networks), and 2) more mail being funneled through the network.

CashFlow

For the last 10 years, from 2001 onwards, UPS has generated free cashflows all except one year.

Balance Sheet

Long term debt on their 2010 balance sheet is minimal (about 10b), together with some others (e.g.: post-retierment benefits), totals about 18b. Thats about 5-6 times their 2010 income (3.4b).

Off the balance sheet: they have another 3bn operating leases and purchase commitments (included in income statement), plus 2.5bn capital lease (not in income statement). All spread out over the next 10 years.


Industry Outlook

Depends on trade (national and international).

In the short term, this depends on the economic cycle.

In the long term, international trade has been increasing since WWII. It would take drastic scenarios for trade to go down (e.g.: trade war, rise of additive manufacturing - a possibility explored by DHL).

Conclusion

Company with a large moat. Half US, half international. Highly cyclical. Buy in a recession.

Friday, October 21, 2011

Defined Pension Plans

Many US companies have underfunded pension plans, which are not shown on thier balance sheets. In a good case, its several years of earnings. In a bad case, the company may be bankrupt.

We are looking at 'Defined Benefits Pension Plans' where the company is liable for providing stipulated retirement benefits for employees at a future point in time. These are unlike the 'Defined Contribution Benefit Plans', where the employee/employer contribute a fixed amount (401K plans in the US, similar to CPF in Singapore). Liabilities for defined benefit pension plans may be quite big, are not on the balance sheet, and therefore ignored by the financial ratios (eg: PE, debt/Equity).

How are Pension Costs Calculated

Aim here is to understand the meaning behind the pension numbers in the financial statement, process and assumptions that go into the numbers we read. Here is how I imagine it they are calculated (I am not an accountant).

Step 1: Get the current 'fair value' of pension fund assets: This is quite straightforward and objective, as most pension plans consist of liquid assets (equities or bonds).

Step 2: Calculate the Projected Benefit Obligation (PBO): really a series of guesses upon guesses:
  • Estimate how much will be owed in future. There is a lot of guesswork here based on the employees' pay rises, retirement age, etc. Some terminology: changes to the final PBO as a result of these assumptions changing are labelled as 'Actuarial loss/gain' or 'Experience loss/gain'.
  • Reduce this to a number in the present by applying a 'discount rate'. This gives the PBO: an estimate of how much you need today to pay off your future obligations.
Step 3: Compare these numbers from steps 1 and 2: Is the plan under or over funded? 'Funded status' must be stated n the footnotes, but if underfunded, the liability does not have to be recognized on the balance sheet...hide it it the footnotes somewhere.

Step 4: Calculate how much the pension cost in the current year, then decide how much of that to expense in the income statement.

Calculate the current pension cost. This appears in the footnotes, something like 'Components of Pension Expense' or 'Net Periodic Benefit Cost'.... It consists of:
  • Service cost: Because all employees are now 1 year closer to retirement.
  • Interest cost: Because we now have 1 year less to payout our obligations. This depends on the 'Discount rate' in Step 2 (higher rate --> lower PBO --> higher interest expense every year).
  • Subtract the Expected return on assets. This can be increased/decreased.
  • The result is how much you expect the pension to cost you every year.
But....this amount does not have to be fully recognized in the income statement. It may be smoothed out (exceptional gains or losses can be deferred over five years).

In summary, its quite a complex model to reduce a set of future estimates into a few simple numbers, and in the end those numbers may not even be added to the income statement or balance sheet.


Summary of Things to Check

From Investopedia:

1) Locate the 'Funded status', if underfunded, is the liability recognized on the balance sheet?

2) Check the assumptions used:
  • Rate of salary increase used to calculate the graph in Step 2.
  • Discount Rate (step 2): Is it reasonably low? I'm not sure....what is a reasonable expected annual compound growth rate for equities or bond investments?
  • Expected Return On Assets in Step 3: Should not be significantly higher than the discount rate.
3) Is the pension cost/expense fully expensed in the income statement, or deferred?

4) See what proportion of the plan is funded by equities and bonds. Bonds are safer: as they are held to maturity, the only risk in holding them is that the underlying company goes bankrupt. Equities may rise or fall in value when the time comes to sell them.


A look at UPS

I'm using United Parcel Services (UPS) as an example, simply because its the next stock I'm looking at. Numbers are from its 2010 annual report. Page numbers refer to the page number in Adobe Acrobat (not the numbers printed at the bottom of the page).

Funding Status:
  • (p89) UPS' pension plan is worth 20m886m, with a BPO of 25,619m. As calculated, it is underfunded by 4.7bn. And all of this underfunding is recognized on the balance sheet (p90).
Assumptions used (mostly on p87 'Actuarial Assumptions'):
  • UPS has been using between 6.5-7% for the past 3 years. This may be acceptable: to me its not conservative, but not high either. p60 states that a 0.25% decrease in the discount rate results in a 850m increase in projected Pension Plan obligations.
  • Return on assets: UPS has used between 9%, and 8.75% in the past 3 years. Seems high, either for equities or bonds. p60 states that a 0.25% decrease in ROA will increase costs by 46m/year.
  • Rate of salary increase. UPS has used 4.5%, seems realistic.
There is an interesting note on p60:

"Our 2011 pension expense will be higher than our 2010 expense due primarily to two negative factors: the decline in discount rate used to determine expense from 6.58% for 2010 to 5.98% for 2011, (good: 6% discount rate is conservative) and the required amortization of unrecognized losses, the majority of which relate to 2008 asset losses, outside of the corridor we utilize for accounting purposes. These negative factors are partially offset by the additional discretionary contributions that we made in 2010 and 2011 that increased the expected return on assets used for expense calculation purposes." (Did they buy equities....? probably not good to buy high in 2010 and 2011 to make up for losses in 2008.)


Is the pension cost fully expensed?
  • The Net Periodic Cost is calculated at $903m (add columns on p87). This was fully expensed in 2011 (p69 cashflow statement - the amount is added to CFO i.e.: deducted from earnings).
  • I think p90 shows a buildup of pension costs from past years (total $5900m in 'Amounts Recognized in AOCI'). Not sure of the terminology - I think it means this just has to be recognized in future years, which is what they were talking about above (interesting note on p60).
Conclusion for UPS Pension Plan:
  • Can't find anything wrong.
  • Wait for the 2011 Annual Report, to see what the BPO looks like with a more realistic 5.98% discount rate, and how much of the of the $5900m accumulated costs (loss) they recognize.